If you are still going after the Lighthouse green score, try doing it for an alternative Lighthouse.
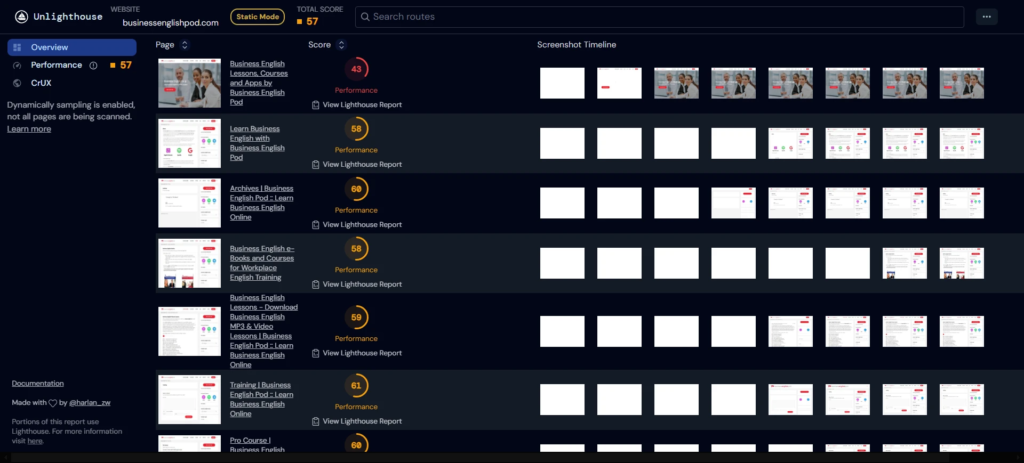
✨Most accurate: Unlighthouse
An alternative Lighthouse offers an opinionated and modified Lighthouse with its own recommendations and diagnostics based on their research.
The default Lighthouse test used in Pagespeed may not be appropriate anymore.
In an analysis done in 2021, 33% of pages with a +90 Lighthouse score didn’t have “Good” LCP metrics. LCP (Largest Contentful Paint) measures when the main content of a page is loaded. This means almost 1/3 of pages who’ve spent resources to have a +90 score, did so for no results at all if the intention was to improve speed.
The default Lighthouse used in Pagessped also only offers CLS metrics for the above-the-fold area.
Take a look at some alternatives below.
Unlighthouse
What if you could run multiple Lighthouse tests like Pagespeed and do a full audit on your Wordpress website? This is what Unlighthouse does.

It is fully configurable and allows running all categories(Performance, Best Practices, Accessibility, SEO, and Progressive Web Apps) or just one such performance.
With Unlighthouse, you can achieve double organic growth by going into the issues and fixing them.
You can also order a custom Unlighthouse run from Wpalpha. We will cover all your important pages(up to 200).
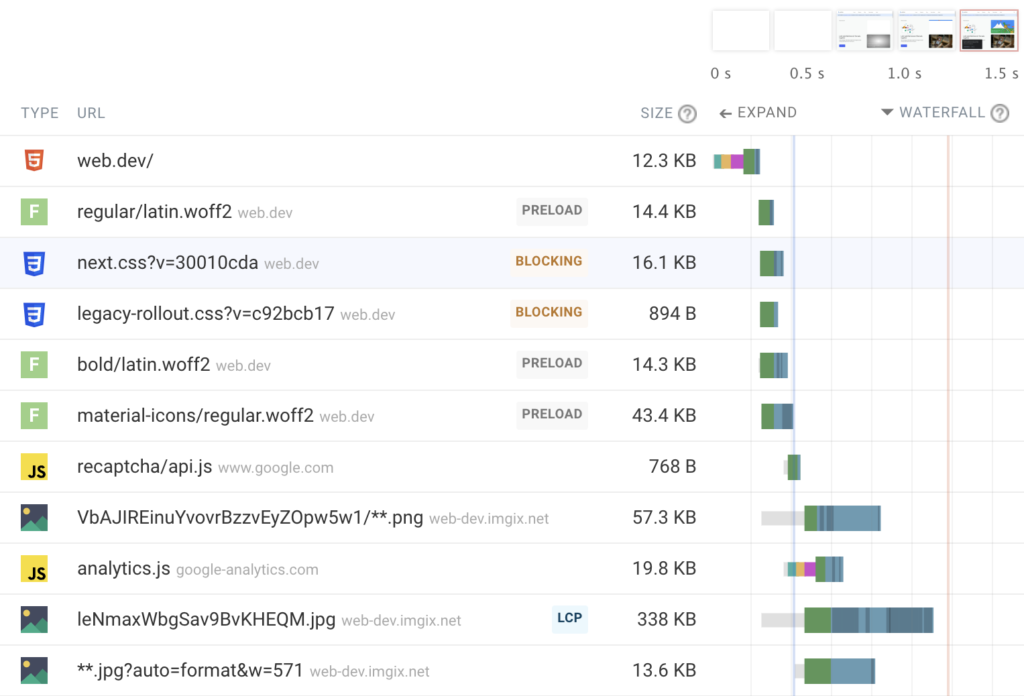
Debugbear
Debugbear offers an opinionated Lighthouse test with additional useful recommendations for many sites. They also have a request waterfall showing the fetchpriority state of assets.

Debugbear also has an INP testing tool, which is the newest Core Web Vitals metric.
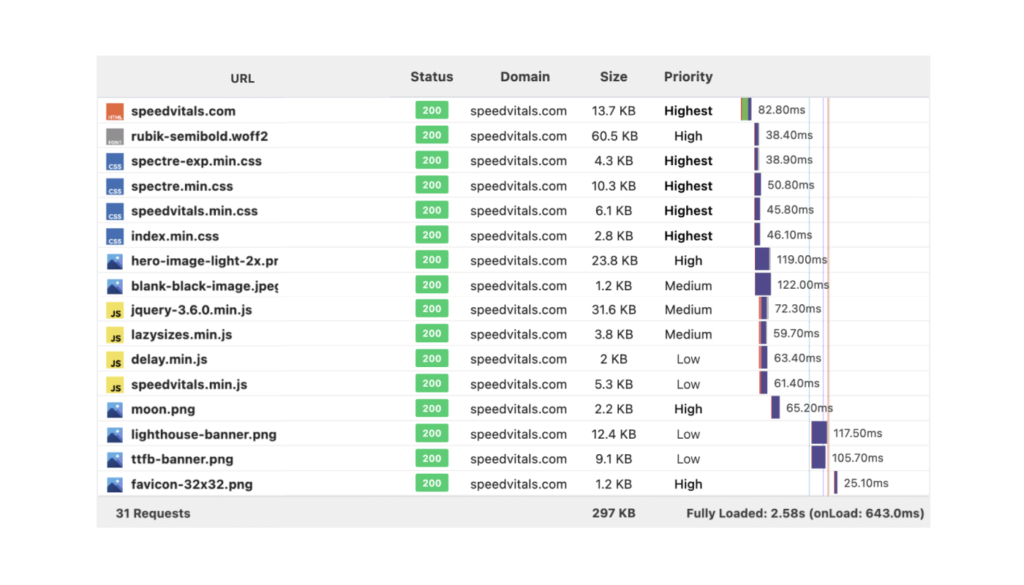
Speedvitals
Speedvitals also has an opinionated Lighthouse test that provides great support for WordPress.
It also has a useful assets waterfall feature.

New Lighthouse modes
Aside from using Pagespeed Lighthouse, try using the new pagespeed modes available on Chrome dev tools(Press F12 on Windows or Option + ⌘ + I on Mac):
Timespan
Timepspan is the Lighthouse mode that allows you to record and test the new Core Web Vital INP metric.
Measure layout shifts and JavaScript execution time over a time range including interactions. Record whatever time range or interactions and then click End timespan:

Timespan is also useful for discovering performance opportunities to improve the experience of long-lived pages and SPAs.
Snapshot
Set up the page in the state you want to evaluate. Then, click Analyze page state:
